I’m excited and happy that it’s finally available. But I’m also relieved as there were times when I thought it would never happen 🙂 In this post, I want to share some details about the course and why I decided to make it.
While playing with EventPipes, I wanted to better understand the Diagnostic IPC Protocol. This protocol is used to transfer diagnostic data between the .NET runtime and a diagnostic client, such as, for example, dotnet-trace. When a .NET process starts, the runtime creates the diagnostic endpoint. On Windows, the endpoint is a named pipe, and on Unix, it’s a Unix domain socket created in the temp files folder. The endpoint name begins with a ‘dotnet-diagnostic-’ string and then contains the process ID to make it unique. The name also includes a timestamp and a ‘-socket’ suffix on Unix. Valid example names are dotnet-diagnostic-2675 on Windows and dotnet-diagnostic-2675-2489049-socket on Unix. When you type the ps subcommand in any of the CLI diagnostics tools (for example, dotnet-counters ps), the tool internally lists the endpoints matching the pattern I just described. So, essentially, the following commands are a good approximation to this logic:
# Linux
$ ls /tmp/dotnet-diagnostic-*
/tmp/dotnet-diagnostic-213-11057-socket /tmp/dotnet-diagnostic-2675-2489049-socket
# Windows
PS me> [System.IO.Directory]::GetFiles("\\.\pipe\", "dotnet-diagnostic-*")
\\.\pipe\dotnet-diagnostic-9272
\\.\pipe\dotnet-diagnostic-13372
The code for the .NET process listing is in the ProcessStatus.cs file. After extracting the process ID from the endpoint name, the diagnostics tool creates a Process class instance to retrieve the process name for printing. Armed with this knowledge, let’s try to intercept the communication between the tracer and the tracee.
Recently, I was looking into the internals of the Visual Studio debugger for the .NET Diagnostics Expert course. I was especially interested in how the Docker debugging works. For those of you who haven’t tried it yet, let me provide a concise description.
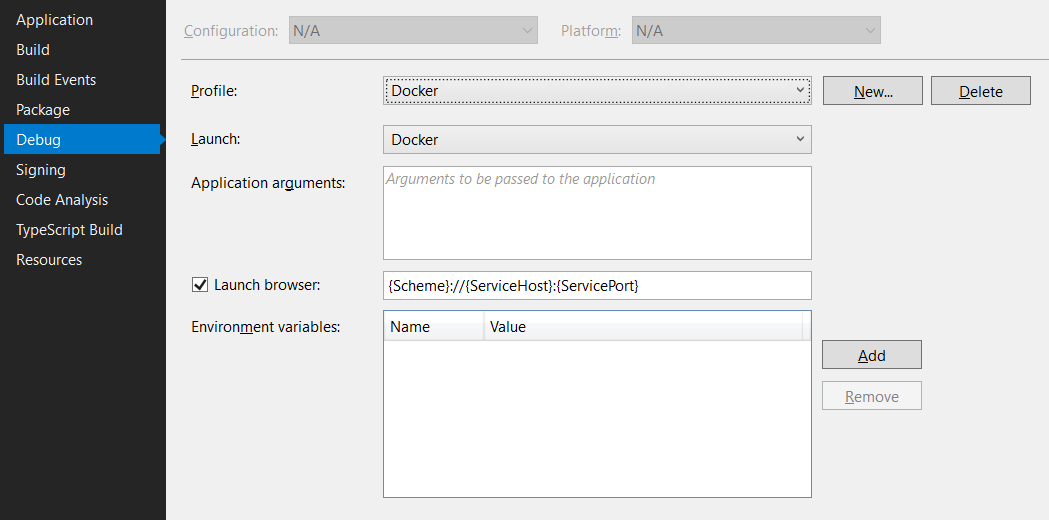
In Visual Studio 2019, when we work on the ASP.NET Core project, it is possible to create a launch profile that points to a Docker container, for example:
And that’s fantastic as we can launch the container directly from Visual Studio. And what’s even better, we can debug it! To make this all work, Visual Studio requires a Dockerfile in the root project folder. The default Dockerfile (which you can create in the ASP.NET Core application wizard) looks as follows:
FROM mcr.microsoft.com/dotnet/core/aspnet:3.1-buster-slim AS base
WORKDIR /app
EXPOSE 80
EXPOSE 443

FROM mcr.microsoft.com/dotnet/core/sdk:3.1-buster AS build
WORKDIR /src
COPY ["WebApplication1.csproj", ""]
RUN dotnet restore "./WebApplication1.csproj"
COPY . .
WORKDIR "/src/."
RUN dotnet build "WebApplication1.csproj" -c Release -o /app/build

FROM build AS publish
RUN dotnet publish "WebApplication1.csproj" -c Release -o /app/publish

FROM base AS final
WORKDIR /app
COPY --from=publish /app/publish .
ENTRYPOINT ["dotnet", "WebApplication1.dll"]
And that’s it. If we press F5, we land inside an application container, and we can step through our application’s code. It all looks like magic, but as usual, there are protocols and lines of code that run this machinery behind the magical facade. And in this post, we will take a sneak peek at them 😊.
While working on a new version of wtrace, I am analyzing the PerfView source code to learn how its various features work internally. One of such features is the call stack resolution for ETW events. This post will show you how to use the TraceEvent library to decode call stacks, and, as an exercise, we will write a sampling process profiler. Before we start, remember to set DisablePagingExecutive to 1. That is a requirement to make call stacks work for ETW sessions.
❗ ❗ ❗ Visit wtrace.net to receive updates on wtrace and my other troubleshooting tools. ❗❗❗
If you are working on Windows, you know that the registry is a crucial component of this system. It contains lots of system and application configuration data. Apps use the registry to access some of the in-memory OS data. Therefore, monitoring the registry activity is one of the essential parts of the troubleshooting process. Fortunately, we have several tools to help us with this task, Process Monitor being probably the most popular one. In this post, though, I am going to prove that we could use ETW for this purpose as well.