How Visual Studio debugs containerized apps

Recently, I was looking into the internals of the Visual Studio debugger for the .NET Diagnostics Expert course. I was especially interested in how the Docker debugging works. For those of you who haven’t tried it yet, let me provide a concise description.

In Visual Studio 2019, when we work on the ASP.NET Core project, it is possible to create a launch profile that points to a Docker container, for example:

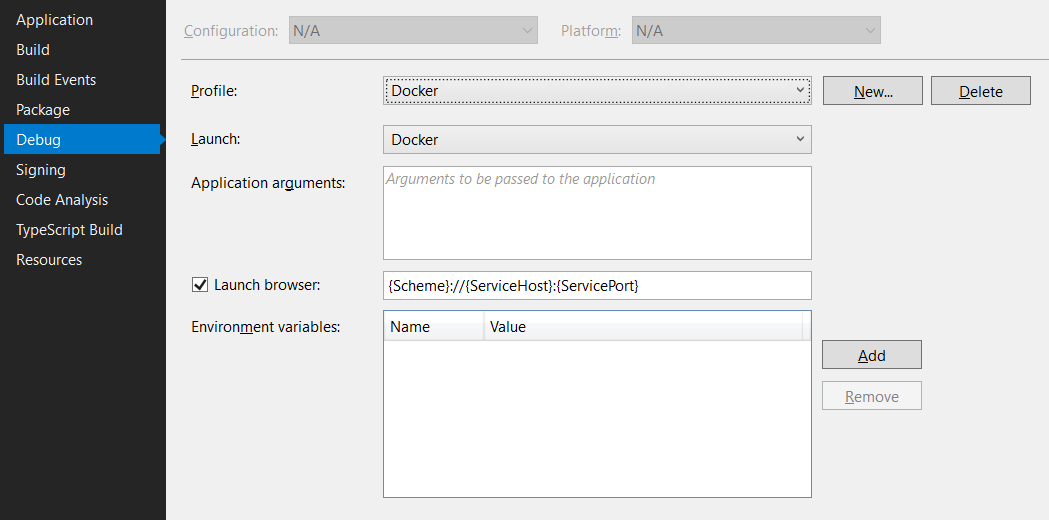
And that’s fantastic as we can launch the container directly from Visual Studio. And what’s even better, we can debug it! To make this all work, Visual Studio requires a Dockerfile in the root project folder. The default Dockerfile (which you can create in the ASP.NET Core application wizard) looks as follows:

FROM mcr.microsoft.com/dotnet/core/aspnet:3.1-buster-slim AS base
WORKDIR /app
EXPOSE 80
EXPOSE 443

FROM mcr.microsoft.com/dotnet/core/sdk:3.1-buster AS build
WORKDIR /src
COPY ["WebApplication1.csproj", ""]
RUN dotnet restore "./WebApplication1.csproj"
COPY . .
WORKDIR "/src/."
RUN dotnet build "WebApplication1.csproj" -c Release -o /app/build

FROM build AS publish
RUN dotnet publish "WebApplication1.csproj" -c Release -o /app/publish

FROM base AS final
WORKDIR /app
COPY --from=publish /app/publish .
ENTRYPOINT ["dotnet", "WebApplication1.dll"]

And that’s it. If we press F5, we land inside an application container, and we can step through our application’s code. It all looks like magic, but as usual, there are protocols and lines of code that run this machinery behind the magical facade. And in this post, we will take a sneak peek at them 😊.

Continue reading

Extracting Service Principal Credentials in VSTS

When we need to deploy an application to Azure from VSTS (Visual Studio Team Services), we use the Azure tasks prepared by Microsoft. These tasks require a contributor account in Azure AD to make changes to your subscription. As this account is not a regular user account but an application account we call it a Service Principal. A very basic build pipeline might look as follows:

vsts-appservice-buildpipeline

The “Azure App Service Deploy” task is an example of a task that will use a Service Principal account to update your App Service in Azure. VSTS makes it easy to create the Service Principal account; it also automatically assigns a contributor role in your subscription to this newly created account. When you want to have full control over your Azure AD you may manually create an App Registration (another name for the Service Principal) in the portal and give it the required rights. You will also need a key to authenticate the service in Azure:

vsts-appregistration

In the next step, you create a new Azure Resource Manager Service Endpoint, providing all the collected information:

Continue reading

Decrypting TFS secret variables

Each build and release definition in TFS has a set of custom variables assigned to it. Those variables are later used as parameters to PowerShell/batch scripts, configuration file transformations, or other tasks being part of the build/release pipeline. Accessing them from a task resembles accessing process environment variables. Because of TFS detailed logging, it is quite common that values saved in variables end up in the build log in a plain text form. That is one of the reasons why Microsoft implemented secret variables.

The screenshot below presents a TFS build configuration panel, with a sample secret variable amiprotected set (notice the highlighted padlock icon on the right side of the text box):

tfssv_secret-variable

Once the secret variable is saved, it is no longer possible to read its value from the web panel (when you click on the padlock, the text box will be cleared).

And this is how the output log looks like if we pass the secret variable to a PowerShell script and print it:

tfssv_masked-log

Let’s now have a look where and how the secret variables are stored.

Continue reading

Read last executed SQL statement from a memory dump

In this post I’m going to show you how to diagnose SQL exceptions using memory dumps. Imagine you have a web application deployed on a production server. Your application is using Elmah configured to log all exceptions to a dedicated table. One day you receive information that users are unable to make orders and in the Elmah log there are lots of SqlTypeExceptions:

SqlDateTime overflow. Must be between 1/1/1753 12:00:00 AM and 12/31/9999 11:59:59 PM.
 at System.Data.SqlClient.TdsParser.TdsExecuteRPC(_SqlRPC[] rpcArray, Int32 timeout, Boolean inSchema, SqlNotificationRequest notificationRequest, TdsParserStateObject stateObj, Boolean isCommandProc, Boolean sync, TaskCompletionSource`1 completion, Int32 startRpc, Int32 startParam)
 at System.Data.SqlClient.SqlCommand.RunExecuteReaderTds(CommandBehavior cmdBehavior, RunBehavior runBehavior, Boolean returnStream, Boolean async, Int32 timeout, Task& task, Boolean asyncWrite)
 at System.Data.SqlClient.SqlCommand.RunExecuteReader(CommandBehavior cmdBehavior, RunBehavior runBehavior, Boolean returnStream, String method, TaskCompletionSource`1 completion, Int32 timeout, Task& task, Boolean asyncWrite)
...

No more information available. If you are using NHibernate you may turn on SQL logging but, if you have thousands of users, this will have a negative impact on the application responsiveness. Another idea might be to use ADO.NET ETW logs – even though this way we will minimize the performance drop, it’s still not a perfect solution. ETW logs weigh hundreds of MB and contain a tremendous amount of information, which you need to filter and analyze. I plan to write about this type of logging in the future. For now, let’s take a third approach: create a production memory dump when the application breaks and analyze it locally in the debugger.
Continue reading

Forget PowerPoint – make a slideshow in… a debugger :)

Few days ago I had a presentation in the Warsaw .NET Group about PDB files. To make the slideshow more attractive (or rather original:)) I decided to replace the PowerPoint with something more connected with the subject, such as… the Visual Studio debugger. The only question was how to actually achieve this. The idea grew in my head after reading a brilliant Mike Stall’s post about debugging dynamically generated code. Mike shows in it how to emit sequence points for a text file of your choice and so bind this file with the generated MSIL. If done correctly, the debugger will load the text file, allowing you to step through its content and at the same time execute the emitted MSIL. So what if we could use the presentation table of contents as our source file and for each title (line of the table of contents) emit MSIL which will present a corresponding slide in the console window? This will actually make the debugger play the role of the PowerPoint:)

Continue reading