How Visual Studio debugs containerized apps

Recently, I was looking into the internals of the Visual Studio debugger for the .NET Diagnostics Expert course. I was especially interested in how the Docker debugging works. For those of you who haven’t tried it yet, let me provide a concise description.

In Visual Studio 2019, when we work on the ASP.NET Core project, it is possible to create a launch profile that points to a Docker container, for example:
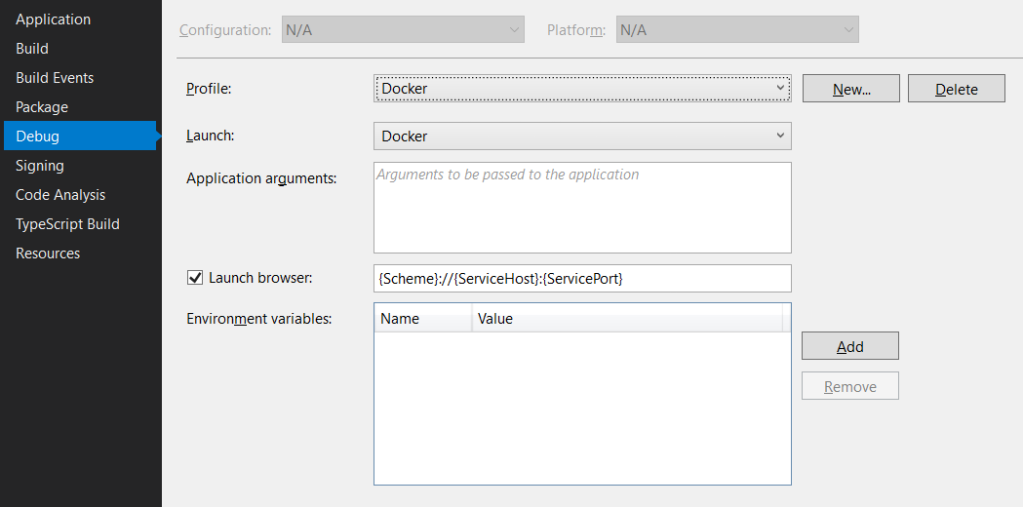
And that’s fantastic as we can launch the container directly from Visual Studio. And what’s even better, we can debug it! To make this all work, Visual Studio requires a Dockerfile in the root project folder. The default Dockerfile (which you can create in the ASP.NET Core application wizard) looks as follows:

FROM mcr.microsoft.com/dotnet/core/aspnet:3.1-buster-slim AS base
WORKDIR /app
EXPOSE 80
EXPOSE 443

FROM mcr.microsoft.com/dotnet/core/sdk:3.1-buster AS build
WORKDIR /src
COPY ["WebApplication1.csproj", ""]
RUN dotnet restore "./WebApplication1.csproj"
COPY . .
WORKDIR "/src/."
RUN dotnet build "WebApplication1.csproj" -c Release -o /app/build

FROM build AS publish
RUN dotnet publish "WebApplication1.csproj" -c Release -o /app/publish

FROM base AS final
WORKDIR /app
COPY --from=publish /app/publish .
ENTRYPOINT ["dotnet", "WebApplication1.dll"]

And that’s it. If we press F5, we land inside an application container, and we can step through our application’s code. It all looks like magic, but as usual, there are protocols and lines of code that run this machinery behind the magical facade. And in this post, we will take a sneak peek at them 😊.

Continue reading

A story of fixing a memory leak in MiniDumper

MiniDumper is a diagnostic tool for collecting memory dumps of .NET applications. Dumps created by MiniDumper are significantly smaller than full-memory dumps collected by, for example, procdump. However, they contain enough information to diagnose most of the issues in the managed applications. MiniDumper was initially developed by Sasha Goldstein, and I made few contributions to its code base. You may learn more about this tool from Sasha’s or my blog posts.

Recently, one of MiniDumper users reported a memory leak in the application. The numbers looked scary as there was a 20MB leak on each memory dump. The issue stayed opened a few weeks before I finally found a moment to look at it. As it was quite a compelling case, I decided to share with you the diagnostics steps in the hope it proves useful in your investigations.

Continue reading

Correlate PIDs with network packets in Wireshark

By default when you record a trace in Wireshark, you won’t find process IDs in it. And sometimes this information is necessary to investigate the problem you are facing. I run into one of such issues this week. I needed to locate a process on a Virtual Machine (local address 10.0.2.5) which was still using TLSv1 to connect to our load balancer. At first, I only recorded traces in Wireshark and filtered them (ssl.record.version == "TLS 1.0"):

initial-tls1-trace

Continue reading

Few facts about OutputDebugString and default settings of the System.Diagnostics.Trace

I recently spent some time analyzing OutputDebugString method. For my another experiment I needed a version of OutputDebugString which depends only on Native API. While implementing it, I discovered few interesting facts about OutputDebugString that maybe will interest you too. The title mentions System.Diagnostics.Trace. It is because the default trace configuration in .NET sends trace messages to an instance of the DefaultTraceListener class, which uses OutputDebugString. And if you do not remove it explicitly from the trace listener collection, your logs will always go through it. You will later see why sometimes it might not be a good idea.

Continue reading

How to decode managed stack frames in procmon traces

Recently, the idea of protected variables in TFS struck my attention and pushed me to do some more research on how exactly those variables are stored. I hope I will write a separate post on that subject, but today I would like to share with you a small trick I use whenever I need to work with managed application traces (and TFS is one of them).

On Windows, when I want to know how things work internally, I usually start with procmon. Seeing which paths and registry keys are accessed, combined with TCP/IP connections is often enough to get an idea where to put breakpoints in further analysis. My TFS investigation was no exception to this rule. I collected a trace while saving a protected build variable – this is how such a variable looks like (in case you are interested :)):

tfs_protected_variable

Continue reading