When we need to change the PE file imports, we might either modify the binary file in the file system or perform updates after it has been loaded to the memory. In this post, I will focus on the latter approach, showing you moments in the process lifetime when such changes are possible. We will end up with a small app capable of updating imports in newly started remote processes.
Continue readingwindbg
COM+ revisited
More than ten years ago (how time flies!), when I published the basic sample of a COM+ server and client, I thought that I wouldn’t be touching this subject again. But here we are, in 2022, and I have so much interaction with COM at work that I decided to write a new, updated, and a bit more detailed post about this technology 😁 I don’t want to convince you to use COM as the backbone for your new applications. Instead, I want to show you how you may approach and use COM APIs if you need to work with them. We will also do some COM debugging in WinDbg. Additionally, I plan to release a new COM troubleshooting tool as part of the wtrace toolkit. Remember to subscribe to wtrace updates if you’re interested.
Continue readingHow Visual Studio debugs containerized apps
Recently, I was looking into the internals of the Visual Studio debugger for the .NET Diagnostics Expert course. I was especially interested in how the Docker debugging works. For those of you who haven’t tried it yet, let me provide a concise description.
In Visual Studio 2019, when we work on the ASP.NET Core project, it is possible to create a launch profile that points to a Docker container, for example:
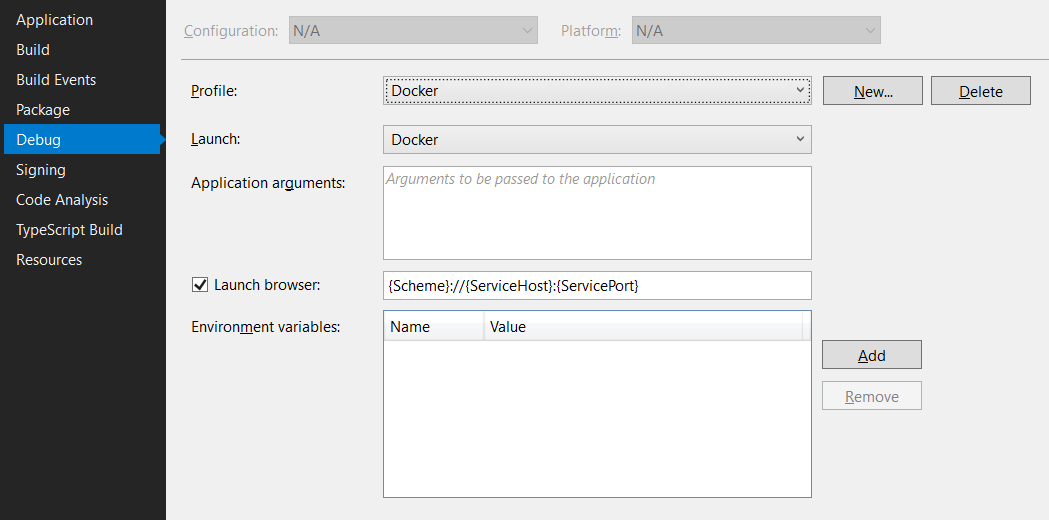
And that’s fantastic as we can launch the container directly from Visual Studio. And what’s even better, we can debug it! To make this all work, Visual Studio requires a Dockerfile in the root project folder. The default Dockerfile (which you can create in the ASP.NET Core application wizard) looks as follows:
FROM mcr.microsoft.com/dotnet/core/aspnet:3.1-buster-slim AS base
WORKDIR /app
EXPOSE 80
EXPOSE 443

FROM mcr.microsoft.com/dotnet/core/sdk:3.1-buster AS build
WORKDIR /src
COPY ["WebApplication1.csproj", ""]
RUN dotnet restore "./WebApplication1.csproj"
COPY . .
WORKDIR "/src/."
RUN dotnet build "WebApplication1.csproj" -c Release -o /app/build

FROM build AS publish
RUN dotnet publish "WebApplication1.csproj" -c Release -o /app/publish

FROM base AS final
WORKDIR /app
COPY --from=publish /app/publish .
ENTRYPOINT ["dotnet", "WebApplication1.dll"]
And that’s it. If we press F5, we land inside an application container, and we can step through our application’s code. It all looks like magic, but as usual, there are protocols and lines of code that run this machinery behind the magical facade. And in this post, we will take a sneak peek at them 😊.
Continue readingSynthetic types and tracing syscalls in WinDbg
Recently at work, I needed to trace several syscalls to understand what SQL Server was doing. My usual tool for this purpose on Windows was API Monitor, but, unfortunately, it hasn’t been updated for a few years already and became unstable for me. Thus, I decided to switch back to WinDbg. In the past, my biggest problem with tracing the system API in WinDbg was the missing symbols for the internal NT objects. Moreover, I discovered some messy ways to work around it. Fortunately, with synthetic types in WinDbg Preview it’s no longer a problem. In this post, I will show you how to create a breakpoint that nicely prints the arguments to a sample NtOpenFile syscall.
A story of fixing a memory leak in MiniDumper
MiniDumper is a diagnostic tool for collecting memory dumps of .NET applications. Dumps created by MiniDumper are significantly smaller than full-memory dumps collected by, for example, procdump. However, they contain enough information to diagnose most of the issues in the managed applications. MiniDumper was initially developed by Sasha Goldstein, and I made few contributions to its code base. You may learn more about this tool from Sasha’s or my blog posts.
Recently, one of MiniDumper users reported a memory leak in the application. The numbers looked scary as there was a 20MB leak on each memory dump. The issue stayed opened a few weeks before I finally found a moment to look at it. As it was quite a compelling case, I decided to share with you the diagnostics steps in the hope it proves useful in your investigations.
Continue reading